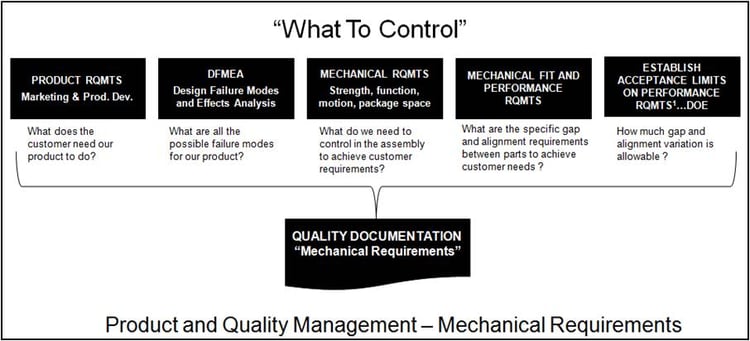
Product manufacturers utilize an organized flow of information to translate customer requirements into product requirements. This process for mechanical requirements is generalized in the flow diagram below.

Tolerance Stack-Ups are vital to address mechanical fit and mechanical performance requirements. Mechanical fit is simply answering the question, “Do the parts that make up the assembly always go together?” Mechanical performance requirements would include the performance of mechanisms, like switches, latches, actuators, and the like. Other performance requirements could include optical alignments or motor efficiency. So what is a “stack-up”?

Tolerance stack-up calculations represent the cumulative effect of part tolerance with respect to an assembly requirement. The idea of tolerances “stacking up” would refer to adding tolerances to find total part tolerance, then comparing that to the available gap or performance limits in order to see if the design will work properly. This simple comparison is also referred to as worst case analysis. Worst case analysis is appropriate for certain requirements where failure would represent catastrophe for a company. It is also useful and appropriate for problems that involve a low number of parts. Low being defined as three or four parts. Worst case analysis is most often done in a single direction, i.e. a 1D analysis. If the analysis involves part dimensions that are not parallel to the assembly measurement being studied, the stack-up approach must be modified since 2D variation such as angles, or any variation that is not parallel with the 1D direction, does not affect the assembly measurement with a 1-to-1 ratio.
Many companies utilize a statistical method for tolerance analysis. One approach involves a simple calculation using the RSS Method, Root-Sum-Squared. Instead of summing tolerances, as in worst-case analysis, statistical analysis sums dimension distributions. It is important to understand that the inputs values for a worst-case analysis are design tolerances, but the inputs for a statistical analysis are process distribution moments (e.g., standard deviation). Worst-case analysis (also called tolerance stack-up analysis) can be used to validate a design. Statistical analysis (also called variation analysis) can be used to predict the actual variation of an assembly based on the variation of the part dimensions. Comparing the assembly standard deviation to the assembly limits allow for the calculation of quality metrics like sigma, % yield, DPMU, etc. This approach requires distributions to be normal with all parts at the same quality level, i.e. +/- 3σ.

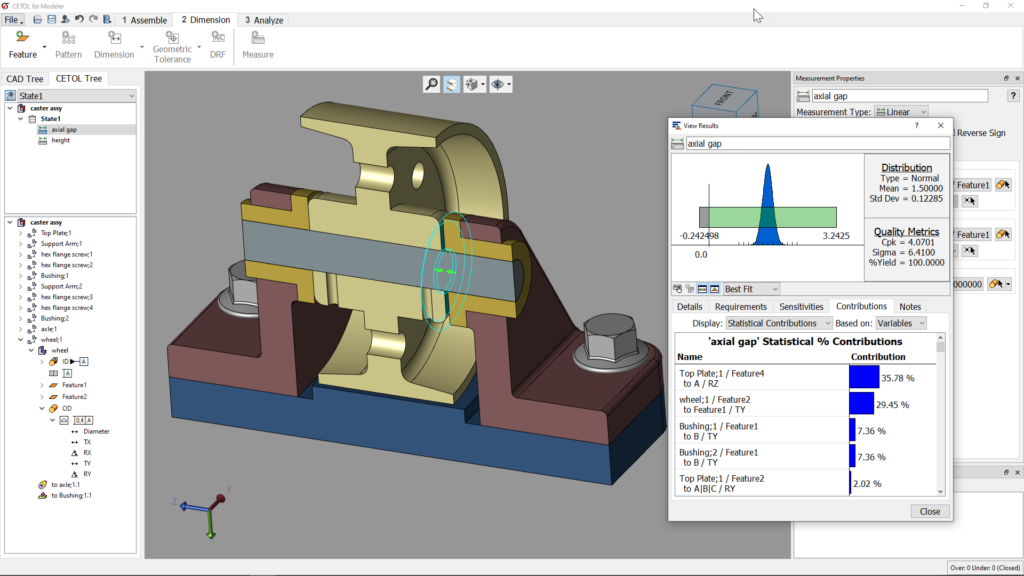
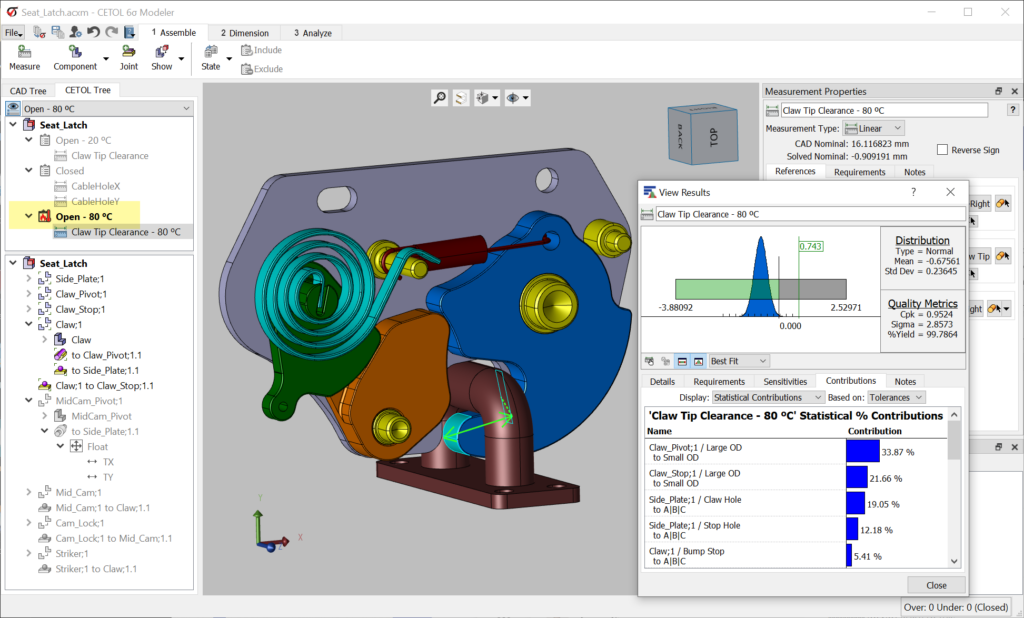
Given the limitations of RSS, other methods for calculating assembly variation have been developed. One such method that is incorporated into CETOL 6 Sigma is called the Method of System Moments. This method eliminates the limitations stated above. Analyses of all complexities, i.e. 1D, 2D, and 3D, can be created with no restriction on distribution type or quality level. Companies can now do full Assembly Variation Analysis with tolerance analysis software.
Assembly variation analysis provides insight required to identify the key part characteristics, (KPCs) that must be controlled in order to produce a product that meets the expectation of the customer. The product development process should then become focused on defining and validating part manufacturing and assembly processes that are capable of achieving high producibility levels. Goals of Cpk = 1.67 for key features and Cp = 1.33 for non-key features are commonly quoted. Utilizing the insight for variation analysis allows design engineers to allocate tolerance budgets strategically. Critical features will be held to tighter tolerances. Looser tolerance can be applied to less important features. These decisions not only ensure product quality and performance, but also ensure manufacturability at the right price. The impact on the product development process can be huge.
See how tolerance analysis software replaces the manual method of creating stack-ups


